Main Body
Module 7 How Does Gender Affect Adult Interpersonal Relationships?
Friendships
Friends play a central role throughout our lives. The term “friend” is often used broadly by people to refer to family members, partners, co-workers, and close acquaintances. However, social researchers use the term to refer to voluntary, informal relationships of a non-sexual nature that we have with people, to distinguish it from relationships we have with relatives and romantic partners (Wrzus et al., 2017). For those in late adulthood, friends continue to provide emotional as well as physical support. Being able to talk with friends and rely on others is very important during this stage of life. Bookwala et al. (2014) found that the availability of a friend played a significant role in protecting the health from the impact of widowhood. Specifically, those who became widowed and had a friend as a confidante, reported significantly lower somatic depressive symptoms, better self-rated health, and fewer sick days in bed than those who reported not having a friend as a confidante. In contrast, having a family member as a confidante did not provide health protection for those recently widowed.
Same-gender Friendships:
In our twenties, intimacy needs may be met in friendships rather than with partners. This is especially true in the United States today as many young adults postpone making long-term commitments to partners, either in marriage or in cohabitation. The kinds of friendships shared by women tend to differ from those shared by men (Bosson et al., 2019). Friendships between men are more likely to involve sharing information, providing solutions, or focusing on activities rather than discussion of problems or emotions. Men tend to discuss opinions or factual information or spend time together in an activity of mutual interest. Friendships between women are more likely to focus on sharing weaknesses, emotions, or problems. Women talk about difficulties they are having in other relationships and express their sadness, frustrations, and joys.
One explanation for these differences is that the masculine gender role discourages men from opening up to others, especially to other men, as this may be seen as a sign of weakness. However, others have suggested that men and women do not differ in the level of intimacy in their friendships, they differ in how they display their closeness (Bosson et al., 2019). This would suggest that the difference found in the research reflects a bias in how closeness/intimacy is often measured. Is willingness to self-disclose the only way we can show intimacy in our friendships? As Bosson and colleagues suggest, “perhaps men and women do have similarly close friendships, but they achieve closeness in somewhat different ways” (p. 335). Moreover, this difference in self-disclosure may be waning. In an analysis of the Facebook posts of young adults, Farber and Nitzburg (2016) found no discernable gender difference in amount of personal information that was being shared with others.
 What about bromances? A bromance, or close heterosexual friendship between males, provides males with a social space for intimacy and emotional disclosure outside of a heterosexual relationship (Robinson et al., 2017). Intimate male friendships are more acceptable now than in previous generations, and males engaged in bromances identify emotional satisfaction and social fulfillment in these relationships. Further, they feel less judged by their close male friends in comparison to their girlfriends. They also indicated they would be more likely to share personal matters and sensitive health information within a bromantic, rather than romantic, relationship. Robinson et al. concluded that men benefit from same-sex relationships, especially if they are not comfortable being emotionally intimate with women, and these relationships can last a much longer time than a romance.
Cross-gender Friendships:
Eighty percent of adults have, or have had, at least one cross-gender friendship (Halatsis & Christakis, 2009) and 40% of all adult friendships are cross-gender (Lenton & Weber, 2006). The challenge for cross-gender relationships is to create a friendship that outsiders and both parties within the relationship can understand (Reeder, 2017). Unlike other social relationships, such as parent-child or romantic partners, there is no clear social script for cross-gender friendships. How do adults in cross-gender friendships conceptualize the relationship? Reeder (2017) found that the most common themes were:
- As family. Often the friend was described as just being like a brother or sister, or in the case of friendships with larger age differences, parent-child. This family-like construction of the friendship helps to explain to both others and each friend the non-sexual nature of the relationship.
- Just like same-sex friends. Here the cross-gender friend is described as being “just like one of the girls/guys”. For many this also helps explain the more platonic nature of the relationship.
- Just as friends. This theme did not borrow from scripted social roles, but was an attempt to show that the relationship was not masking something else.
All of these themes suggest that cross-gender friends were seen as close, equal, and non-sexual. A fourth theme, Reeder called role conflict, highlighted the inability of some adults in cross-gender friendships to create a clear narrative about the friendship because of their own ambiguity about the relationship.
In a second study, Reeder asked college aged men and women about their cross-gender friendships and whether they would characterize them as like a sibling, one of guys/girls, just as friends, romantic partner, parent, or competitor. The same three themes emerged as the primary themes. Women were most likely to describe a male friend as being like a brother, followed by just a friend, and like one of the girls. Men were most likely to describe a female friend as just a friend, then like a sister, and like one of the guys. Males and females were equally satisfied in their cross-gender friendships. However, those who described the friendship in more romantic terms had the lowest rating of satisfaction. Such adults were perhaps experiencing role conflict and were having difficulty “creating a perception and experience of the friendship that [was] distinct from romance.” (p. 157). There were few respondents who described their friendship as like a romantic relationship and there was no gender difference on this in Reeder’s study. However, other researchers have noticed a difference.
As previously indicated, cross sex friendships among straight individuals are common (Bleske-Recheck et al., 2012). However, concerns have been raised that one member of the friendship has romantic, rather than platonic, desires. To test this, Ward (2012) interviewed a large cohort of friends and found that males see many opportunities for romance in their platonic opposite-sex friendships. The women in these friendships, however, seem to believe they are just platonic. Results indicated that the two people were experiencing the same relationship in different ways, and men have a difficult time being “just friends”. According to Ward,
“The results suggest large gender differences in how men and women experience opposite-sex friendships. Men were much more attracted to their female friends than vice versa. Men were also more likely than women to think that their opposite-sex friends were attracted to them—a clearly misguided belief. In fact, men’s estimates of how attractive they were to their female friends had virtually nothing to do with how these women actually felt, and almost everything to do with how the men themselves felt—basically, males assumed that any romantic attraction they experienced was mutual, and were blind to the actual level of romantic interest felt by their female friends. Women, too, were blind to the mindset of their opposite-sex friends; because females generally were not attracted to their male friends, they assumed that this lack of attraction was mutual. As a result, men consistently overestimated the level of attraction felt by their female friends and women consistently underestimated the level of attraction felt by their male friends” (p. 1).
Bleske-Rechek et al. (2012) also found that emerging adult males reported more attraction to their female friend than emerging adult females did. This attraction was regardless of their own or their friend’s current relationship status. When assessing whether attraction affected the friendship, both emerging and middle-aged adult males and females indicated that an attraction to their cross-sex friend was more of a cost to the relationship than a benefit. Additionally, emerging adult females and middle-aged participants who reported more attraction to a cross-sex friend reported less satisfaction in their current romantic relationship. The authors concluded that there were potential negative consequences to cross-sex friendships.
Friendships for Sexual and Gender Minorities:
An important psychological function of friendship is social support outside of the family (Wrzuz et al., 2017), and for gender and sexual minorities this may be crucial if it is lacking from their family. Gillespie et al. (2015) used a large scale survey to examine gender, age, and sexual orientation differences in the number of same-gender and cross-gender friendships, and the extent to which people felt they could rely on their same-gender and cross-gender friends. They looked at three areas of friendship: expressive (could discuss personal issues with their friends), instrumental (they could turn to their friends to help them), and companionate (they would do things with their friends). Overall, what they found was greater similarity than difference in friendship across all genders and sexual orientations, with a few notable differences.
- Homophily, the notion that people affiliate more with those like themselves was more common among heterosexual survey respondents, as they reported more same-gender friends than cross-gender friends. This is not surprising given the added complication for heterosexuals of managing both the real, and possibly assumed, sexual attraction in cross-gender friendships.
- In terms of the dimensions of expressive, instrumental, and companionate support, very little difference was found between men and women, with the exception that women reported that they had more friends that they could talk to about very intimate issues such as one’s sex life, regardless of their age or sexual orientation.
- For all groups, overall life satisfaction was related to friendship satisfaction, regardless of the number of friends. The strongest association between life and friendship satisfaction was found for lesbians and bisexual men and women. This may support the idea that friendship may be especially important psychologically for sexual and gender minorities, who may experience less acceptance from their families.
In high school and college, students who are attracted to the same sex, often seek out other students with same sex attractions (Martin-Storey et al., 2015). In adulthood, sexual and gender minority members may form an intentional chosen family, a circle of friends who understand the challenges of being LGBTQ+ and who can support them (Frost et al., 2016).
Adult Lifestyles
There is a diversity of adult lifestyles, and many adults experience not just one but several over the course of their life. For some adults a deliberate decision is made to stay single, cohabitate, get married, or become a parent. For others, circumstances determine that choice. For example, in cultures where same-sex marriage is not allowed, cohabitation becomes the only option available. When a marriage sours, divorce or the prospect of living alone is the possible lifestyle. This section will also examine dating relationships, and the forms of caregiving adults provide to children and to other adults.
Singlehood:
The number of young adults (age 18-34) who are not in a committed or dating relationship is more than 50%, according to a recent survey (NORC, 2020). This has been trending upward since 2004 when it was a third of young adults. The NORC survey also found that more women than men reported that they were neither dating nor in a committed relationship (55% of female, 40% of male respondents). A Pew Research survey of Americans (Wang & Parker, 2014) found that while just over half (53%) of unmarried adults say they would eventually like to get married, 32 percent are not sure, and 13 percent do not want to get married. It is projected that by the time current young adults reach their mid-40s and 50s, almost 25% of them may not have married. Recent Pew Research (Brown, 2020a) shows that half of singles are not even interested in dating, especially women over age 40. A number of older singles, both men and women feel they are “too old” , “just like being single” or like young adults, “have more priorities right now”.
The U.S. is not the only country to see a rise in the number of single adults. The following table lists some of the reasons young adults give for staying single.
| Have not met the right person | 30% |
| Do not have financial stability | 27% |
| Not ready to settle down | 22% |
| Too young to marry | 22% |
In addition, adults are marrying later in life, cohabitating, and raising children outside of marriage in greater numbers than in previous generations. Young adults also have other priorities, such as education, and establishing their careers. This may be reflected by changes in attitudes about the importance of marriage. In the same Pew Research survey (Wang & Parker, 2014), respondents were asked to indicate which of the following statements came closer to their own views:
- “Society is better off if people make marriage and having children a priority”
- “Society is just as well off if people have priorities other than marriage and children”
Slightly more adults endorsed the second statement (50%) than those who chose the first (46%), with the remainder either selecting neither, both equally, or not responding. Young adults age 18-29 were more likely to endorse this view than adults age 30 to 49; 67 percent and 53 percent respectively. In contrast, those age 50 or older were more likely to endorse the first statement (53 percent).
There may be an added problem for never-married young women. Many are seeking a similar male with a steady job. However, for every 100 never-married females, there are only 91 never-married young men who are steadily employed (Wang & Parker, 2014). It is important to note that those who are single now, may have once been among the ranks of the married, and some never-married adults may be willing to consider someone who is divorced. In addition, not all young adults will necessarily be limiting their search to those from their own age group, or even the opposite gender. However, it appears that the pool for potential mates is narrower for some young women, and thus the odds of staying single, and even never-married single, seems higher.
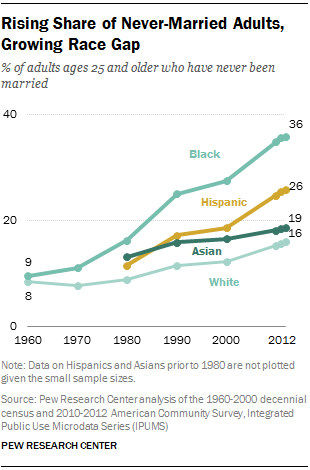
The increase in never married adults shows a difference among racial groups. In most racial and ethnic groups, men are more likely than women to have never been married. The major exception is among Blacks. In 2012, an approximately equal share of black men (36%) and black women (35%) ages 25 and older had never been married. In 1960, black men were more likely than black women to have never been married (12% vs. 8%). Among Whites, Hispanics and Asians, men are more likely than women to have never been married, and the gender gap among Whites and Hispanics has widened in recent decades (Wang & Parker, 2014).
Dating in Young Adults:
The ways people are finding love has changed with the advent of the Internet. Nearly 50 million Americans have tried an online dating website or mobile app (Bryant & Sheldon, 2017). Online dating has also increased dramatically among those age 18 to 24. Today, one in two young adults report using a mobile dating app or website (Vogels, 2020), almost triple the rate in 2013 (Smith & Anderson, 2016). However, a number of users of online dating sites have reported being harassed by others on the site. Women almost twice as likely to report being harassed, with 18-34 year-old females reporting the highest level of harassment.
| Type of Harassment | Percentage of Women | Percentage of Men |
|---|---|---|
| Continued to contact them after being told they were not interested | 48 | 27 |
| Sent sexually explicit images or materials they did not ask for | 46 | 26 |
| Called them offensive names | 33 | 22 |
| Threatened to physically harm them | 11 | 6 |
Online dating apps are especially popular among those who identify as lesbian, gay, or bisexual, with 55% saying that they had used such apps in comparison of 28% who identify as straight (Anderson et al., 2020). They are also twice as likely as those who identify as straight to report having found a partner using online dating apps (21% vs. 11%). However, they have also more likely to report having been the victims of harassment (Brown, 2020b).
| Type of Harassment | Percentage of LGB | Percentage of Straights |
|---|---|---|
| Continued to contact them after being told they were not interested | 48 | 35 |
| Sent sexually explicit images or materials they did not ask for | 56 | 32 |
| Called them offensive names | 41 | 25 |
| Threatened to physically harm them | 17 | 7 |
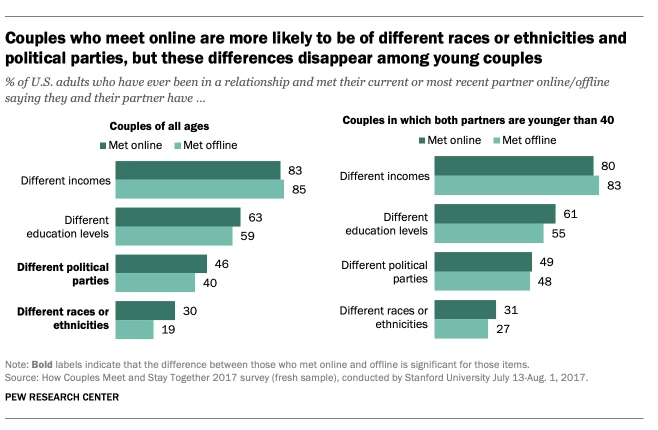
According to a recent survey of couples who met online versus offline (Brown, 2020a), those who met online tended to have slightly different levels of education and political views from their partners, but the biggest difference was that they were much more likely to come from different racial and ethnic backgrounds. This is not surprising as the average age of the couples who met online was 36, while the average age of couple who met offline was 51. Young adults are more likely to seek, and be in, a relationship with people who are different from them, regardless of how they met.
To evaluate what heterosexual individuals are looking for online, Menkin et al. (2015) reviewed data from an eHarmony.com relationship questionnaire completed by a cross-sectional representation of 5,434 new users. Their results indicated that users consistently valued communication and characteristics, such as personality and kindness over sexual attraction. Females valued communication over sexual attraction, even more when compared to males, and older users rated sexual attraction as less important than younger users. Alterovitz and Mendelsohn (2011) analyzed 600 Internet personal ads across the lifespan and found that men sought physical attractiveness and offered status related information more than women, while women were more selective than men and sought status more than men. These findings were consistent with previous research on gender differences regarding the importance of physical/sexual attraction.
Dating in Later Life:
 Most research on dating, and especially those studies that use online dating sites, focus on the dating habits of young adults. However, online dating is becoming an increasingly popular option for older adults (Gewirtz-Meydan & Ayalon, 2018). Older women (over age 50) are more likely to use online dating sites than are older men (AARP, 2012). A possible reason for this gender difference may be that women tend to be more cautious in moving toward a new relationship (McWilliams & Barrett, 2014), and online dating sites may allow them to dip their toes to test the waters. In addition, women have a smaller dating pool from which they can choose, as there are fewer single men their age in their local communities. Online dating sites widen the pool.
Research shows that older adults do realize the “age penalty” they face when trying to navigate the dating market. McWilliams and Barrett (2014) found that older adults may downplay or misrepresent their age, and will highlight the more youthful activities they engage in. These researchers also found that the gender stereotypes play a role in how older men and women present themselves, with men emphasizing their socioeconomic status and women their attractiveness. All of this highlights a cultural paradox which implies “that while sexuality [is] crucial to remaining youthful and aging successfully, youth and beauty [are] essential requisites for active sexual engagement” (Gewirtz-Meydan & Ayalon, 2018, p. 487). In addition, many online dating sites perpetuate this stereotype in how they market themselves to older singles. In their analysis of home page photos on 39 dating sites geared toward older adults, Gewirtz-Meydan and Ayalon found that most sites portray older adults as younger and active, but more conservatively dressed to downplay the sexuality of older adults. In addition, the sites are also very heteronormative in the images they display to prospective users, even though some of their clients are not heterosexual.
Forming Relationships:
The development of romantic relationships is a significant milestone for young adults. However, our knowledge of relationship development is largely based on heterosexuals, and what research does exist on sexual and gender minorities focuses on negative outcomes, such as HIV. Do relationships develop and progress in a similar manner in heterosexual and LGBT couples? First let us consider the models for heterosexual relationships.
There are two models used to describe the development of romantic relationships among heterosexual couples, the stage model of romantic relationships and the process model of romantic relationships. The stage model (Levinger, 1980) proposes that there is a linear sequence of stages that are associated with increasing commitment. In this model individuals are attracted to each other, build up their relationship by engaging in behaviors that promote bonding and interdependence, assess the suitability of the partner, and continue to deepen their commitment, or eventually the relationship deteriorates and ends. The process model (Baxter & Bullis, 1986) proposes that interpersonal processes, such as closeness, trust, commitment, and interdependence are the mechanisms that can guide relationships in different directions. This suggests that the direction is not always linear and that events can become a “turning point” in the relationship depending on these internal processes such as trust or commitment.
Macapagal et al. (2015) assessed whether these models explain the development of relationships among LGBT couples. The authors found that both models had support, although there was more support for the process model. They also found that here were some unique experiences of LGBT couples that were not completely captured by some of the research with heterosexuals.
 In terms of the stage model, their interviews with couples did provide clear support for there being a progression toward more serious commitment, such as eventually living together, or discussion of getting married. However, there were several factors that moderated this progression that would not be found in heterosexual relationships. For instance, most LGBT couples met through LGBT social networks, meaning that the individual had to have come out about their LGBT status. Cisgender heterosexuals do not have to make such a proclamation, nor do they need to seek out a “heterosexuals only” social network to find a potential partner. Thus, even starting a relationship may have additional obstacles for LGBT adults. In addition, cohabitation in their sample often occurred among LGBT youth who lacked family support about their gender or sexuality, meaning it may have occurred earlier before the relationship was fully committed. The progression of commitment was also often stymied if at least one partner was still concealing their LGBT status to family or friends. This can lead to low relationship visibility and can make it harder for a couple to invest in the relationship (Macapagal et al., 2015).
There was also support for the process model. Interpersonal processes, such as trust and interdependence, were common themes in the interviews with LGBT couples, just as they are with heterosexual couples (Macapagal et al., 2015). Similar to heterosexual couples, ambivalence about the relationship could stall its progression. Finally, LGBT couples often found that working together to overcome disapproval, or other social stressors, because of their gender or sexual minority status often strengthened their relationship. A finding that is consistent with research showing that shared problems can sometimes strengthen relationships in heterosexual couples (Frost, 2011).
Cohabitation:
In American society, as well as in a number of other cultures, cohabitation has become increasingly commonplace (Gurrentz, 2018). For many young adults, cohabitation has become more commonplace than marriage. While marriage is still a more common living arrangement for those age 25-34, cohabitation has increased, while marriage has declined. Gurrentz also found that cohabitation varies by socioeconomic status. Those who are married tend to have higher levels of education, and thus higher earnings, or earning potential. Many cohabitating adults (44%) see cohabitation as a step toward marriage (Graff 2019). However, this too varies greatly by level of education attained. Only 28% of those with only a High School diploma or less, while 50% of those with a Bachelor’s degree or higher entered into cohabitation with eventual marriage in mind. Similar increases in cohabitation have also occurred in other industrialized countries. For example, rates are high in Great Britain, Australia, Sweden, Denmark, and Finland. In fact, more children in Sweden are born to cohabiting couples than to married couples. The lowest rates of cohabitation in industrialized countries are in Ireland, Italy, and Japan (Benokraitis, 2005). Until recently, for many sexual minorities cohabitation was, and still is, the only option as many nations define marriage as between a man and a woman.
Marriage:
Cohen (2013) reviewed data assessing most of the world’s countries and found that marriage has declined universally during the last several decades. This decline has occurred in both poor and rich countries, however, the countries with the biggest drops in marriage were mostly rich: France, Italy, Germany, Japan and the U.S. Cohen states that the decline is not only due to individuals delaying marriage, but also because of high rates of non-marital cohabitation. Delayed or reduced marriage is associated with higher income and lower fertility rates that are reflected worldwide.
All major racial and ethnic groups have experienced a decline in marriage. Currently-married adults under age 65 dropped about 10 percentage points for Whites, Blacks, and Hispanics since 1990. For Asians, the drop was 3 percentage points. In 2016, more than half of Asians (60%) and Whites (53%) were married, compared with 45% of Hispanics and 29% of Blacks (Wang, 2018). For comparison, in 1960, 72% of adults age 18 or older were married (Wang & Taylor, 2011). In 2020, the US saw a 12% decline in the rate of marriage (Westrick-Payne & Manning, 2022). This decline likely reflects the difficulty in having a wedding during the pandemic.
Americans adults ages 65 and older are slightly more likely to be married today than older adults a few decades ago. This change is largely due to a decline in the share of widowed adults. Those ages 75 and older benefit most from this trend: 39% were widowed in 2016, down from 53% in 1960. During the same period, the proportion of currently-married adults ages 75 and older has increased from 36% to 45%.
Men and women ages 18 to 64 are equally likely to be married, and the marriage share has declined for both genders over the years. In 2016, 48% of men and 49% women ages 18 and older were married, down from 59% and 60% in 1990, respectively. At the same time, the age of first marriage has been increasing for both men and women. In 1960, the average age for first marriage was 20 for women and 23 for men. By 2018 this had increased to 28 for women and 30 for men (Geiger & Livingston, 2019). Many of the explanations for increases in singlehood and cohabitation previously given can also account for the drop and delay in marriage.

In June 26, 2015, the United States Supreme Court ruled that the Constitution guarantees same-sex marriage. The decision indicated that limiting marriage to only heterosexual couples violated the 14th amendment’s guarantee of equal protection under the law. This ruling occurred 11 years after same-sex marriage was first made legal in Massachusetts, and at the time of the high court decision, 36 states and the District of Columbia had legalized same sex marriage. Worldwide, 29 countries currently have national laws allowing gays and lesbians to marry (Pew Research Center, 2019). In 2022, both the House and Senate passed The Respect for Marriage Act, which protects same-sex marriage after the Supreme Court overturned Roe v. Wade and Judge Thomas quipped that this could be a sign of things to come (Warburton, 2022).
Many cultures have both explicit and unstated rules that specify who is an appropriate mate. Consequently, mate selection is not completely left to the individual. Rules of endogamy indicate the groups we should marry within and those we should not marry in (Witt, 2009). For example, many cultures specify that people marry within their own race, social class, age group, or religion. Endogamy reinforces the cohesiveness of the group. Additionally, these rules encourage homogamy or marriage between people who share social characteristics. The majority of marriages in the U. S. are homogamous with respect to race, social class, age and to a lesser extent, religion. Homogamy is also seen in couples with similar personalities and interests.
Marriage vs. Cohabitation:
 Both love and companionship are the main reasons why adults choose to marry or cohabitate, although both are lower among those who choose to cohabitate rather than marry (Horowitz et al., 2019). Finances (38%) and convenience (37%) are the main reasons why adults choose to cohabitate. In contrast, only 13% of married adults cite finances and 10% cite convenience as reasons why they chose to marry.
Married adults are more likely than those who are cohabitating to indicate that things are going very well in their relationship (Horowitz et al., 2019). They report higher levels of satisfaction with their relationship, including communication between partners, how household chores are divided, parenting styles, and work-life balance. Both married and cohabiting adults report that they are equally satisfied with their sex life. Married adults are also more likely to report trusting their partner to be faithful, to be honest with them, and to act in their best interest. Horowitz reports that this link between marriage and trust remains even after controlling for demographic differences (e.g., education, age, race, religion, and gender).
Divorce:
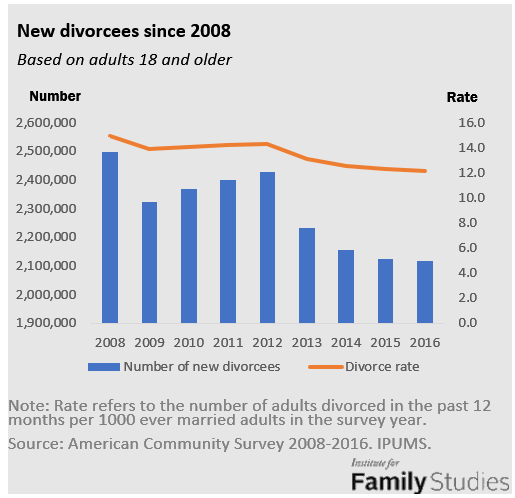
Although a smaller share of adults is married today, among those who are married, their likelihood of divorce is also lower. After increasing between 2009 to 2012, the number of new divorcees has dropped every year, reaching a record low of 2.1 million in 2016 (Wang, 2018). The divorce rate (measured by the number of adults who got a divorce in the past 12 months per 1,000 ever married adults) is also down from 14 to 12 per 1,000 ever-married adults during the same period. The drop in the divorce rate is mostly relevant for adults under age 64. The number of new divorcees per 1,000 ever-married adults declined from 18 in 2008 to 15 in 2016 in this age group.
In 2020, the US saw a 12% decline in the rate of divorce, which corresponded to a similar drop in the rate of new marriages (Westrick-Payne & Manning, 2022). The difficulty in meeting with lawyers or in obtaining a court date for divorce during the pandemic is a likely reason for this drop in the divorce rate. Westrick-Payne and Manning noted that several US states have reported a backlog in divorce cases.
Livingston (2014) found that 57% of divorced adults were women. This reflects the fact that men are more likely to remarry than are women. Almost 70% of divorces are initiated by women (Rosenfeld, 2017). This is nothing new. Goode’s (1956) survey of women in the 1940s found two-thirds of the divorces were initiated by women. Moreover, this gender difference is not just applicable to the US. More women in England, Australia, Canada, and Europe are initiated by women (Rosenfeld, 2017). In his survey of American women, Rosenfeld found that married women reported much lower levels of “quality” of the relationship than did married men, or men and women in non-martial relationships. Rosenfeld note that his results support the feminist assertion that some women experience heterosexual marriage as oppressive or uncomfortable, and that husbands are still expecting women to take on the bulk of housework and child care at a time when her roles outside of the home have changed.
Most divorces take place within the first 5 to 10 years of marriage (AARP, 2009). This time line reflects people’s initial attempts to salvage the relationship. After a few years of limited success, the couple may decide to end the marriage. It used to be that divorce after having been married for 20 or more years was rare. In recent years the divorce rate among more long-term marriages has been increasing, with the divorce rate among those ages 65 and older has been stable in recent years, staying around 3 new divorcees per 1,000 ever-married adults each year since 2008. At the same time, the rise of so-called “gray divorce” among those ages 50 and older seems to have leveled off. The divorce rate among this group has been around 7 per 1,000 ever-married adults in the past 8 years after an increase since 1990 (Brown & Lin, 2013).
Brown and Lin suggest several reasons for the “graying of divorce”. There is less stigma attached to divorce today than in the past. Some older women are out-earning their spouses, and thus may be more financially capable of supporting themselves, especially as most of their children have grown. Finally, given increases in human longevity, the prospect of living several more years or decades with an incompatible spouse may prompt middle-aged and older adults to leave the marriage.
 A survey by AARP (2009) found that men and women had diverse motivations for getting a divorce. Women reported concerns about the verbal and physical abusiveness of their partner (23%), drug/alcohol abuse (18%), and infidelity (17%). In contrast, men mentioned they had simply fallen out of love (17%), no longer shared interests or values (14%), and infidelity (14%). Both genders felt their marriage had been over long before the decision to divorce was made, with many of the middle-aged adults in the survey reporting that they stayed together because they were still raising children. Females also indicated that they remained in their marriage due to financial concerns, including the loss of health care (Sohn, 2015).
Living Alone:
Across the world, women are twice as likely as men to age alone (Ausubel, 2020). For women aged 60 and older, 20 percent live alone compared to 11 percent of men. All 20 countries with the highest percentages of older women living alone are in Europe, including Lithuania (where 50% of older women live alone), Denmark and Hungary (both 47%). The smallest number of older women living alone are in Afghanistan, Mali and Pakistan, at roughly 1%. The fact that women live longer and are typically younger than their male partners may explain this difference. However, cultural norms and countries that offer fewer retirement benefits or support for older adults place greater responsibility on families to provide care for their elders.
Parenthood
The majority of American mothers and fathers (58%) say being a parent is extremely important to their identity, and another 36% say it is very important (Pew Research Center, 2015). For fathers, 57% say being a dad is extremely important to their overall identity, and 58% of mothers say the same about being a mom. Additionally, black and white parents are equally likely to say being a parent is an extremely important part of their identity (61% and 62%, respectively).
Motherhood:
 Most women in the Unites States become a mother at some point in their adult lives. According to 2018 data from the US Census (2019) by age 50 only 15% of American women were still childless, meaning being a mother is a common experience and social role for women. Becoming a mother is a life-changing event for most women that can trigger a transition in identity (Hennekam et al., 2017). Women need to incorporate this new role and new relationship, along with the sociocultural expectations of being a mother into their identity.
Most of the childcare, as with other domestic duties, is performed by women, although the gender gap for childcare between mothers and fathers has narrowed in recent years. However, parents are not the only people who take care of children, and these people are usually female, either a relative or paid caregiver (Bosson et al., 2019).
Today, most mothers work. Depending on the organizational climate, women who work during pregnancy or return to work after giving birth, may find the workplace less inviting. The maternal body, both during and after birth, can be viewed as disruptive to an organization, and thus women may experience subtle but hostile reactions in the workplace (Joshi et al., 2015). Workplaces also vary in how family-friendly are their policies, and spouses and partners differ in how they help working mothers who are juggling family and work responsibilities.
What determines who does what when diving up domestic labor? What accounts for the vast difference in how couples answer this question? Three general theories have been suggested.
- The time-availability theory: Couples may decide how much domestic work a partner does based on how much time each person has available. Research does show that men and women who spend more time in employed work do spend less time on household and childcare duties (Aassve et al., 2014). However, this does not explain why in heterosexual couples, women still do the bulk of domestic chores. Moreover, couples who work different shifts may find that it is not so much the time that you have available that determines household chores, but when you have the time available.
- The relative income theory: Couples may exchange household duties in lieu of income. This could explain why even women who work do more of the domestic work as well. Women typically make less than their husbands. However, do women who make more income than their male partners do less household work? Most of the research on this topic is prior to 2005, yet it suggests that the answer is no. In fact, two studies found that when the woman makes more money, the husband does even less housework (Bittman, et al., 2003; Brines, 1994).
- The gender role ideology theory: Couples’ beliefs about gender roles influences their division of domestic work. Aassve and colleagues (2014) did find that couples with more egalitarian beliefs did tend to divide the housework more evenly. An answer to the paradox identified in the previous item may be found here with the gender role ideology theory. Men whose wives earn more, or on whom they are more financially dependent may feel their sense of being a man threatened. One way to restore their sense of masculinity is to avoid “women’s work”.
While becoming a parent is a desire of many women, regardless of what a woman achieves in education or work there is still the motherhood mandate, the social expectation that she will have children. Ultimately women are viewed in relation to motherhood no matter what is their chosen role (Drury, 2016). Friends, family, even total strangers may bring up the question of children, and women who remain child-free by choice elicit feelings of contempt and moral outrage by others (Ashburn-Nardo, 2017). Ashburn-Nardo found that people appear to believe that becoming a parent is a moral imperative.
For women who chose to work, the motherhood mandate can become a double edged sword. In a society that often determines worth by how much money someone makes, women who choose to stay-at-home with their children may run the risk of being viewed as unproductive (Ruitenberg, 2014). Mothers who choose to work, may be seen as neglecting their children (Drury, 2016), or not as committed to their jobs (Gatrell et al., 2017), and those who choose to work and remain childless are viewed as being selfish and unfulfilled (Drury, 2016). This is not something that fathers experience should they choose to work, or if men decided to remain childless. One reason for this difference is that the institution of motherhood, with its roles, rules, and prohibitions, is not the same as the act of mothering. Motherhood is viewed in most cultures from the perspective of essentialism; as something that is the natural state of being a woman (Drury, 2016). As a result, women experience considerable social pressure to become a mother (Drury, 2016).
As noted above, the motherhood mandate requires women to become mothers. However, some women are often considered exempt, such as lesbians. This is because motherhood is shaped by heteronormativity. Lesbian mothers are constantly confronted with the definition of motherhood that assumes heterosexuality. In addition, lesbians are often considered unfit to be parents as they do not fit the standard of heterosexuality (Rogalin & Brooks, 2018). Interestingly by becoming a parent, lesbians may gain social acceptance from family and others (Hayman & Wilkes, 2017), and may be redefining what constitutes family, motherhood, and reproduction (Rogalin & Brookes, 2018).
This heteronormative view of motherhood can even affect some lesbians’ views about their infertility. Toadvine (2015) found that the internalization of homophobia by some lesbian women struggling with infertility led them to assume that being lesbian was the cause of their inability to conceive or maintain a pregnancy. These women’s explanations ranged from “it was probably for the best as they would probably be a terrible mother” to their bodies were “homophobic”.
Fatherhood:
About 62% of men (approximately 75 million) are fathers to biological, step, or adopted children (Monte, 2019). Research on fathers has focused on both direct and indirect influences (Else-Quest & Hyde, 2018). Indirect factors include the father’s behavior affecting some other factor in the child’s life, such as the mother. Direct factors are the behaviors and attitudes modeled by the father, as well as the father-child interactions. Direct involvement with their children can positively affect child development, especially when fathers are sensitive and responsive to their child’s needs. Loving fathers promote their child’s overall well-being, while decreasing aggressiveness and behavioral concerns. Further, children of involved fathers possess higher IQs, more advanced language and cognitive skills, and stronger self-regulation. In contrast, when fathers are less engaged and negative, children are more likely to develop externalizing problems.
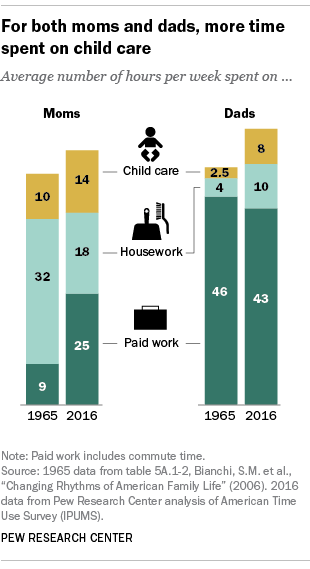
Fathers, Childcare and Housework: In reviewing how parents spent their time in 2016, fathers reported spending an average of eight hours a week on child care, which is three times the amount of time they provided in 1965 (Livingston & Parker, 2019). Fathers also indicated that they put in about 10 hours a week on household chores in 2016, which increased from four hours in 1965. By comparison, mothers spent an average of about 14 hours a week on child care and 18 hours a week on housework in 2016. While they’re spending more time with their children, many dads still feel they are not as involved as they would like. Most fathers (63%) said they spend too little time with their children compared with 35% of mothers. Work obligations were most often given as the reason for the lack of involvement. Among fathers of biological children below the age of 18, about 25% do not live with all of their minor biological children. The amount of time spent with their children who reside with their mother varies, although the majority of fathers indicate they see their children several times per week (Monte, 2019).
Stay-at-Home Fathers: According to a Pew Research Center analysis of U.S. Census Bureau data, 17% of all stay-at-home parents in 2016 were fathers, up from 10% in 1989 (Livingston, 2018a). This modest increase is due to both fathers’ unemployment and fathers saying they are home specifically to care for their home or family. This difference suggests that changing gender roles appear to be a factor as 24% of stay-at-home fathers indicated they are home specifically to care for the family. Fathers who stay-at-home are more likely to have a college degree (25%) compared with the 17% of dads who are home for other reasons. In addition, fathers who stay at home to care for family are far more likely than those at home for other reasons, such as being unemployed or having health issues, to have a working spouse. Consequently, they are less likely to be living in poverty.
 Stay-at-home fathers are often subjected to stigma and stereotyping as they challenge the male role model of being the “breadwinner” (Matilla, 2020). Some stay-at-home dads identify loneliness and social isolation, while others report high levels of life satisfaction. How the father’s felt was often connected to the social setting. Matilla examined social spaces and places where stay-at-home fathers experienced social dynamics that oppressed, affirmed or validated their identities as male caretakers. Based on these spaces, five distinct identities emerged:
- Hero: In gender neutral public spaces, such as stores and restaurants, stay-at-home fathers were seen as engaging and nurturing and were celebrated as heroic. Fathers indicated that they often drew positive attention from others and were complimented on their caretaking roles.
- Pervert of the Playground: In playgrounds dominated by mothers and female nannies with children, stay-at-home fathers felt shunned and judged, especially when they were the only male present. Some fathers stopped going to the playground because they felt they were perceived as pedophiles, creeps, or predators that would harm the females and children present.
- Unwelcome Intruder: In play groups that are typically arranged for mothers to interact with other mothers, a stay-at-home dad is considered an unwelcome intruder. Fathers who attempted to join play groups felt alienated and keenly aware of being different from the moms in the group.
- Man among Men: As a response to the loneliness experienced by stay-at-home fathers, formal male-only groups of primary caregivers have been established in several metropolitan areas. These men-only groups of caregivers offer a place for men to express a form of masculinity reflecting their sense self as nontraditional caretakers. Men identified feeling safe with other men as they were not continually being scrutinized by others.
- Communal Father: Volunteering at a child’s educational setting has traditionally been a role for stay-at-home mothers. Stay-at-home fathers have also begun to volunteer at school, and once they have proven they do not constitute a risk of sexual inappropriateness for children, their presence becomes that of a communal, respected and wise father. Unlike the playground, which is informal, the school is a formal institution where rules regarding conduct and a hierarchy are maintained. Consequently, fathers may be placed into leadership positions because of their gender and ride the glass elevator to the top of the volunteers.
Lesbian and Gay Parents:
 Research has consistently shown that the children of lesbian and gay parents are as successful as those of heterosexual parents, and consequently efforts are being made to ensure that gay and lesbian couples are provided with the same legal rights as heterosexual couples when adopting children (American Civil Liberties Union, 2016).
Patterson (2013) reviewed more than 25 years of social science research on the development of children raised by lesbian and gay parents and found no evidence of detrimental effects. In fact, research has demonstrated that children of lesbian and gay parents are as well-adjusted overall as those of heterosexual parents. Specifically, research comparing children based on parental sexual orientation has not shown any differences in the development of gender identity, gender role development, or sexual orientation. Additionally, there were no differences between the children of lesbian or gay parents and those of heterosexual parents in separation-individuation, behavior problems, self-concept, locus of control, moral judgment, school adjustment, intelligence, victimization, and substance use. Further, research has consistently found that children and adolescents of gay and lesbian parents report normal social relationships with family members, peers, and other adults. Patterson concluded that there is no evidence to support legal discrimination or policy bias against lesbian and gay parents.
Unmarried Parents:
Although the majority of children in America reside with parents who are married, the percentage of children residing with a single mother, single father, or cohabitating parents has risen (Livingston, 2018b). In 2017, 25% of all parents in the United States were unmarried. Also in 2017, the share of unmarried parents who were solo mothers declined to 53%. This decline was due to an increases in cohabiting parents as 35% of all unmarried parents were living with a partner. Unmarried parents who are solo fathers has remained at 12% for almost 50 years. The makeup of U.S. families are very changeable, and according to Livingston, by the time they turn 9 more than 20% of U.S. children born to a married couple and over 50% of those born to a cohabiting couple will have experienced the breakup of their parents. The declining stability of families is due to increases in cohabitation, which tend to be less long-lasting than marriages, as well as parental divorce. In fact, half of solo parents in 2017 (52%) and one-third of cohabitating parents (35%) had been married at one time.
Women are more likely to be single parents: Across the world, women ages 35 to 59 are more likely than their male counterparts to live in single-parent households (Ausubel, 2020). World wide, women are four times as likely as men to live with one or more minor children and no other adults (4% of women vs. 1% of men). This gap is biggest among Christians (7% of women vs. 2% of men), especially in sub-Saharan Africa where single-parent households are common. Gaps are smaller, but still notable among Jewish, Muslims, Hindus and the religiously unaffiliated. However, Buddhist men and women do not differ much on this measure. In sub-Saharan Africa, 9% of middle-aged women and 2% of middle-aged men live in single-parent households, followed closely by North America (8% of women vs. 2% of men) and the Latin America-Caribbean region (7% of women vs. 1% of men). Men tend to live in single-parent homes at about the same rate all over the world, and any differences in rates of single parenthood affect women almost exclusively.
Caregiving
The sandwich generation refers to adults who have at least one parent age 65 or older and are either raising their own children or providing support for their grown children. According to a Pew Research survey, nearly a half of middle-aged adults are part of this sandwich generation (Parker & Patten, 2013). In addition, 15% of middle-aged adults are providing financial support to an older parent while raising or supporting their own children. According to the same survey, almost half of middle-aged adults, have supported their adult children in the past year, and over a quarter are the primary source of support for their grown children.
Women are more likely to take on the role of care provider for older parents in the U.S. and Germany (Pew Research, 2015). About 20% of women say they have helped with personal care, such as getting dressed or bathing, of aging parents in the past year, compared with 8% of men in the U.S. and 4% in Germany. In contrast, in Italy men are just as likely (25%) as women (26%) to have provided personal care. The Pew survey (Parker & Patten, 2013) found that almost a third of the sandwich-generation adults were more likely to say they always feel rushed, while less than a fourth of other adults said this. However, the survey suggests that those who were supporting both parents and children reported being just as happy as those middle-aged adults who did not find themselves in the sandwich generation. However, adults who are supporting both parents and children did report greater financial strain.

According to the National Alliance for Caregiving (2015), 40 million Americans provide unpaid caregiving, and much of this falls on the shoulders of women. The typical caregiver is a 49 year-old female currently caring for a 69 year-old female who needs care because of a long-term physical condition. Looking more closely at the age of the recipient of caregiving, the typical caregiver for those 18-49 years of age is a female (61%) caring mostly for her own child (32%) followed by a spouse or partner (17%). When looking at older recipients (50+) who receive care, the typical caregiver is female (60%) caring for a parent (47%) or spouse (10%).
When caring for a disabled spouse, gender differences have also been identified. Female caregivers of a spouse with dementia experienced more burden, had poorer mental and physical health, exhibited increased depressive symptomatology, took part in fewer health-promoting activities, and received fewer hours of help than male caregivers (Gibbons et al., 2014).
Care for chronically ill or aging family members takes its toll physically, emotionally, and financially. Daughters are more likely to provide basic care, such as dressing, feeding, bathing, and transporting, and sons are more likely to provide financial assistance (Schulz & Eden, 2016). Some adult children choose to leave the work force, however, the cost of leaving the work force early to care for an aging or ill family member is high. For females, lost wages and social security benefits equals $324,044, while for men it equals $283,716 (Metlife, 2011). This loss can jeopardize the adult child’s financial future.
Similar to caregiving, in all families there is a kinkeeper, a person or persons who keep the family connected and who promote solidarity and continuity in the family (Brown & DeRycke, 2010). Who in your own family do you count on to organize family gatherings? Who knows the history of your family? Who do people turn to in your family for advice and support? Who works to strengthen the bonds between members of your family? These are your family’s kinkeepers, and they are usually women (Leach & Braithwaite, 1996; Brown & DeRycke, 2010). Leach and Braithwaite found that 86% of their respondents named a woman as their family’s kinkeeper, and Brown and DeRycke found that mothers, maternal grandmothers, and paternal grandmothers were more likely to be a family’s kinkeeper than were fathers, young adult children, and grandfathers combined. Brown and DeRycke also found that among young adults, women were more likely to be a kinkeeper than were young adult men.
In the next module we will examine how gender influences people’s experiences in college and in the workplace. We will consider how it influences people’s choices in careers, and the unique challenges faced by the genders.
