Main Body
Module 2 How Do We Study Gender?
Case Study: Bias in Medical Research

It may surprise some consumers that “there are no mandatory FDA requirements for prospectively designing clinical trials to investigate the impact of one’s sex on drug receptivity or adverse effects or for conducting appropriate and complete analysis by sex” (McGregor et al., 2016, p.xx). Not surprisingly most participants in clinical trials are male, unless the drug or treatment is targeted for a problem faced only by females. Research with animals shows the same gender bias, with studies using only males, not reporting the gender of the animals, or not reporting whether gender had any impact on outcomes (Beery & Zucker, 2011). In response to this growing concern, the National Institute of Health (NIH, 2015) has made the government funding of research contingent on sex being “factored into research designs, analyses, and reporting in vertebrate animal and human studies. Strong justification from the scientific literature, preliminary data, or other relevant considerations must be provided for applications proposing to study only one sex” (para. 4). While the topic of health and gender will be considered in more detail in a later module, a growing body of research is showing that there is a reason to be concerned about the absence of females in clinical trials (Regitz-Zagrosek, 2012).
Another source of bias is how researchers, and the general public, interpret findings of gender differences. When researchers find a difference in the performance between groups in their study they often report whether the finding was statistically significant. What does that mean? Was there a big difference in performance; a slight difference? As you learned in Introduction to Psychology, statistical significance only tells you how unlikely this difference was due to chance. What it does not tell you is how large or important is this difference. This is a point we will come back to later in the module. Some people, including scientists, when ascribing meanings to findings of gender differences take a maximalist approach, emphasizing differences and often assuming no real overlap in the performance of different genders, while others take a minimalist approach, and assume that although the difference is statistically significant, there is likely considerable overlap (Unger & Crawford, 1996). The maximalist approach can lead people to ignore the similarities between genders. This can lead to the perpetuation of stereotypes and exaggerate beliefs about the genders. However, the minimalist approach also has its risks as differences do exist among the sexes and genders. Consequently, either bias in interpreting differences is helpful. What researchers and the general public need to ask is how important are these differences, and what do these differences mean.
Research in the Psychology of Gender
An important part of learning any science, including psychology, is having a basic knowledge of the techniques used in gathering information. The hallmark of scientific investigation is that of following a set of procedures designed to keep questioning or skepticism alive while describing, explaining, or testing any phenomenon. Science involves continuously renewing our understanding of the subjects in question and an ongoing investigation of how and why events occur. The scientific method is the set of assumptions, rules, and procedures scientists use to conduct research (Lally & Valentine-French, 2019). The following information explains the different types of research designs (Lally & Valentine-French, 2019):
- Research design is the specific method a researcher uses to collect, analyze, and interpret data. Psychologists use many types of research designs in their research, and each provides an essential avenue for scientific investigation.
- Descriptive research is research that describes what is occurring at a particular point in time.
- Correlational research is research designed to discover relationships among variables and to allow the prediction of future events from present knowledge.
- Experimental research is research in which a researcher manipulates one or more variables to see their effects.
- Ex post facto research is research in which groups of people are compared on a participant variable, such as men and women.
- Quasi-experimental research includes both participant variables and experimental (manipulated) variables (Bosson et al., 2019). These main methods and examples will be examined below.
Descriptive Research
Case Study: Sometimes the data in a descriptive research project are based on only a small set of individuals. These research designs are known as case studies which are descriptive records of one or a small group of individuals’ experiences and behavior. Sometimes case studies involve ordinary individuals, but more frequently, case studies are conducted on individuals who have unusual or abnormal experiences. The assumption is that by carefully studying these individuals, we can learn something about human nature. Case studies have a distinct disadvantage in that, although it allows us to get an idea of what is currently happening, it is usually limited to static pictures. Although descriptions of particular experiences may be interesting, they are not always transferable to other individuals in similar situations. They are also time consuming and expensive, as many professionals are involved in gathering the information.
Observations: Another type of descriptive research is known as observation. When using naturalistic observation, psychologists observe and record behavior that occurs in everyday settings. However, naturalistic observations do not allow the researcher to have any control over the environment. Laboratory observation, unlike the naturalistic observation, is conducted in a setting created by the researcher. This permits the researcher to control more aspects of the situation. Concerns regarding laboratory observations are that the participants are aware that they are being watched, and there is no guarantee that the behavior demonstrated in the laboratory will generalize to the real world.

Survey: In other cases the data from descriptive research projects come in the form of a survey, which is a measure administered through either a verbal or written questionnaire to get a picture of the beliefs or behaviors of a sample of people of interest. The people chosen to participate in the research, known as the sample, are selected to be representative of all the people that the researcher wishes to know about called the population. A representative sample would include the same percentages of genders, age groups, ethnic groups, and socio-economic groups as the larger population.
Surveys gather information from many individuals in a short period of time, which is the greatest benefit for surveys. Additionally, surveys are inexpensive to administer. However, surveys typically yield surface information on a wide variety of factors, but may not allow for in-depth understanding of human behavior. Another problem is that respondents may lie because they want to present themselves in the most favorable light, known as social desirability. They also may be embarrassed to answer truthfully or are worried that their results will not be kept confidential. Additionally, questions can be perceived differently than intended.
Interviews: Rather than surveying participants, they can be interviewed which means they are directly questioned by a researcher. Interviewing participants on their behaviors or beliefs can solve the problem of misinterpreting the questions posed on surveys. The examiner can explain the questions and further probe responses for greater clarity and understanding. Although this can yield more accurate results, interviews take longer and are more expensive to administer than surveys. Participants can also demonstrate social desirability, which will affect the accuracy of the responses.
Psychophysiological Assessment: Researchers may also record psychophysiological data, such as measures of heart rate, hormone levels, or brain activity to help explain behavior. These measures may be recorded by themselves or in combination with behavioral data to better understand the bidirectional relations between biology and behavior.
Secondary/Content Analysis involves analyzing information that has already been collected or examining documents or media to uncover attitudes, practices or preferences. There are a number of data sets available to those who wish to conduct this type of research. For example, the U. S. Census Data is available and widely used to look at trends and changes taking place in the United States. The researcher conducting secondary analysis does not have to recruit participants, but does need to know the quality of the information collected in the original study.
Correlational Research
In contrast to descriptive research, which is designed primarily to provide static pictures, correlational research involves the measurement of two or more relevant variables and an assessment of the relationship between or among those variables. For instance, the variables of height and weight are systematically related (correlated) because taller people generally weigh more than shorter people.
The Pearson Correlation Coefficient, symbolized by the letter r, is the most common statistical measure of the strength of linear relationships among variables. The value of the correlation coefficient ranges from r= –1.00 to r = +1.00. The strength of the linear relationship is indexed by the distance of the correlation coefficient from zero (its absolute value). For instance, r = –.54 is a stronger relationship than r= .30, and r = .72 is a stronger relationship than r = –.57. The direction of the linear relationship is indicated by the sign of the correlation coefficient. Positive values of r (such as r = .54 or r = .67) indicate that the relationship is positive (i.e., the pattern of the dots on the scatter plot runs from the lower left to the upper right), whereas negative values of r (such as r = –.30 or r = –.72) indicate negative relationships (i.e., the dots run from the upper left to the lower right).
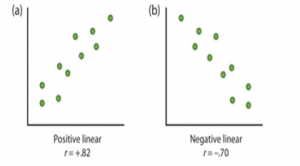
When individuals have high values for one variable also tend to have high values for the other variable, as in part (a), the relationship is said to be positive correlation. In contrast, negative correlations, as shown in part (b), occur when high values for one variable tend to be associated with low values for the other variable.
An important limitation of correlational research designs is that they cannot be used to draw conclusions about the causal relationships among the measured variables. Consider, for instance, Swartout’s (2013) study where he surveyed college men about their peer’s attitudes toward women and measured the male respondents own hostility toward women. Swartout found that men whose peers held more hostile views toward women were positively correlated with the men’s own hostility toward women. While it is possible that the views of peers may influence an individual’s views and actions, it is possible that these men selected peers who held similar views to their own. Still another possible explanation for the observed correlation is that it has been produced by the presence of a third variable.
A third variable is a variable that is not part of the research hypothesis but produces the observed correlation between them. In our example, a potential third variable is men’s adherence to the male gender role norms. Their adherence to such norms may shape their attitudes toward women; it may also lead them to associate with peers who hold similar views. While it may appear that peers’ views influence individual views on women, it may be due to the unmeasured variable of adherence to the male gender role that is causing both individual and peer attitudes.
For this reason, we are left with the basic limitation of correlational research: Correlation does not demonstrate causation! It is important that when you read about correlational research projects, you keep in mind the possibility of third variables.
Correlational research can be used when experimental research is not possible because the variables cannot be manipulated or it would be unethical to use an experiment. Correlational designs also have the advantage of allowing the researcher to study behavior as it occurs in everyday life. We can also use correlational designs to make predictions. For instance, we can predict from the scores on a measure of masculinity, men’s body image issues. However, we cannot use such correlational information to determine whether one variable caused another variable. For that, researchers rely on an experiment.
Experimental Research
The goal of the experimental method is to provide more definitive conclusions about the causal relationships among the variables in a research hypothesis than what is available from correlational research. Experiments are designed to test hypotheses, or specific statements about the relationship between variables. Experiments are conducted in a controlled setting in an effort to explain how certain factors or events produce outcomes. A variable is anything that changes in value. In the experimental research design, the variables of interest are called the independent variable and the dependent variable. The independent variable in an experiment is the causing variable that is created or manipulated by the experimenter. The dependent variable in an experiment is a measured variable that is expected to be influenced by the experimental manipulation.
A good experiment randomly assigns participants to at least two groups that are compared. Random assignment refers to using chance to determine which condition of the experiment research participants receive. The experimental group receives the treatment under investigation, while the control group does not receive the treatment the experimenter is studying as a comparison. Additionally, experimental designs control for extraneous variables, or variables that are not part of the experiment that could inadvertently effect either the experimental or control group, thus distorting the results.
A psychologist studying gender might be interested in whether people perceive males and females differently, and whether those perceptions influence people’s interpretation of the behavior of someone they have been told is male or female. The psychologist could videotape two children dressed in snowsuits throwing snowballs and engaged in rough and tumble play. The psychologist would then randomly assign some research participants to a group that is told that the children are boys, while other participants are randomly assigned to a group that is told that the children are girls. The psychologist might then measure how aggressive the participants in both groups label the children’s behavior. In this study, the variable being manipulated (independent variable) is whether participants are led to believe the children are male or female. The variable that is expected to change (dependent variable) as a result of that manipulation is the participants’ ratings of aggressiveness. This was the scenario behind a landmark study by Condry and Ross (1985). Adults gave lower ratings of aggression in the play behavior when they were lead to believe that the two children were boys, than when they were lead to believe that at least one or both children were girls. Rough and tumble play is often seen as more typical play behavior for boys, thus is viewed as “playful” rather than aggressive.
Despite the advantage of determining causation, experiments do have limitations. One is that they are often conducted in laboratory situations rather than in the everyday lives of people. Therefore, we do not know whether results that we find in a laboratory setting will necessarily hold up in everyday life. In addition, some variables are not experimental variables as we cannot randomly assign people to these variables. Such variables include age, gender, sex, ethnicity, race, and socioeconomic status. These are called participant variables as they are naturally occurring characteristic of the research participant, and they are measured rather than manipulated.
Ex Post-Facto Research
In ex post-facto research the researcher uses pre-existing groups, such as men and women, and compares them on a dependent variable (Bosson et al., 2019). For instance, psychologists might want to test whether women talk more than men. The researcher might watch men and women interacting with a target person and count the number of words they use in a set time interval. On the surface, these studies look like experiments, but the absence of random assignment makes them more correlational than experimental.
Quasi-experimental research
Psychologists might incorporate both experimental and participant variables into their research. This is the quasi-experiment. In a Quasi-experiment only some variables are actually manipulated by the experimenter, and participants are randomly assigned to these variables only. Participants cannot be randomly assigned to variables like age or gender. These variables are not truly experimental, but are being used to understand participants reactions in the study. The value of quasi-experiments is that they allow researchers to examine the interaction between experimental variables and participant variables.
Meta-analysis and Effect Size
|
Interpreting Effect Sizes |
|
| d value | Meaning |
| 0.00-0.10 | Near Zero |
| 0.11-0.35 | Small |
| 0.36-0.65 | Medium |
| 0.66-1.00 | Large |
| >1.00 | Very Large |
| Source: Hyde (2005) | |
|---|---|
Once several studies have been conducted on a topic, such as whether there are gender differences in math skills, researchers can combine the results of these studies to look for general trends in the research. A meta-analysis is a technique for analyzing and integrating the results from several studies (Hyde, 2005). The unit of analysis in meta-analysis is effect size, which is a way of quantifying the difference between two groups. For instance, a study may find a statistically significant difference between the performance of males and females on a measure of arithmetic. While statistical significance tells us that the observed difference was unlikely due to chance, it does not tell us whether the difference was meaningful or trivial. One common method for calculating the effect size is the d statistic, which quantifies the difference between group means in standardized units. In a single study, the d statistic would express the difference between the average female and the average male score in units of standard deviation. In meta-analysis, the d statistic is the average sex difference in standard deviation units across all the studies that were used in the meta-analysis. A negative d value shows a female advantage and positive d value conveys a male advantage.
Let us look at some examples:
- Height is 2.0. These means that the average male is taller than the average female. This difference would be considered a very large difference.
- Perceptual speed is -.48. This indicates that the average female responds quicker to perceptual tasks than the average male. This difference represents a medium effect size.
- Self-esteem for those aged 60 and over is .03. This indicates a negligible difference between males and females.
The d statistic will be used throughout the textbook to indicate the significance of gender differences.
Between Group and Within Group Variance
Another way to consider effect size is in terms of how much overlap there is between comparison groups. The more overlap between the distribution of scores of two groups the more similar are the performance of the two groups. Between-group variance refers to the difference between the average score of each group, while the within-group variance refers to how spread out are the scores within a group. For instance the average American male weighs 197.8 pounds and the average American female weighs 170.5 pounds (CDC, 2020). This would describe the between group variance. Yet, not all American men weigh 197.8 pounds. This would describe the within-group variance.
APA Guidelines for Conducting Ethical Research
One of the issues that all scientists must address concerns the ethics of their research. Research in psychology may cause some stress, harm, or inconvenience for the people who participate in that research. Psychologists may induce stress, anxiety, or negative moods in their participants, expose them to weak electrical shocks, or convince them to behave in ways that violate their moral standards. Additionally, researchers may sometimes use animals, potentially harming them in the process.
Decisions about whether research is ethical are made using established ethical codes developed by scientific organizations, such as the American Psychological Association, and federal governments. In the United States, the Department of Health and Human Services provides the guidelines for ethical standards in research. The following are the American Psychological Association code of ethics when using humans in research (APA, 2016).
- No Harm: The most direct ethical concern of the scientist is to prevent harm to the research participants.
- Informed Consent: Researchers must obtain informed consent, which explains as much as possible about the true nature of the study, particularly everything that might be expected to influence willingness to participate. Participants can withdraw their consent to participate at any point.
- Confidentiality: Researchers must also protect the privacy of the research participants’ responses by not using names or other information that could identify the participants.
- Deception: Deception occurs whenever research participants are not completely and fully informed about the nature of the research project before participating in it. Deception may occur when the researcher tells the participants that a study is about one thing when in fact it is about something else, or when participants are not told about the hypothesis.
- Debriefing: At the end of a study debriefing, which is a procedure designed to fully explain the purposes and procedures of the research and remove any harmful aftereffects of participation, must occur.
Guidelines for Gender-Fair Research
Bosson et al. (2019) outline five guidelines to promote gender-fair research.
- Researchers should always report the demographics of their sample. Studies that use only one gender should not generalize to others. In addition, samples should not be selected because of assumptions based on the topic, such as studying only mothers when the topic is on parenting. Researchers should also examine whether their findings differ based on the demographic samples.
- Researchers should use “non-gender biased, non-evaluative terminology” (Bosson et al, 2019, p.67), when describing their sample or findings. Researchers should avoid androcentric, hetero-centric terminology or avoid interpreting their findings from a andro- or heteronormative model.
- Researchers should avoid exaggerating the rate and size of gender differences. Researchers need to make clear the distinction between statistical significance and substantive significance. Not all statistically significant results are large or have practical importance. Researchers need to report effect sizes.
- Researchers should avoid implying gender differences are due to biological causes if biological factors were not examined. This is a particular caution when examining some of the claims made by evolutionary psychologists. Discovering a gender difference among 21st century men and women does not imply a biological underpinning. Biological explanations should only be given if biological variables were measured.
- Researchers should reflect on their assumptions that may underlie their research questions, methods, and interpretation of the findings. Researchers should examine both confirming and disconfirming evidence. They should critically review how their assumptions about gender or other social issues may influence the questions they ask in their research. Researchers should also consider the intersectionality of gender with other variables.
Guidelines for Representative Participants
An important area that especially needs to be addressed is the lack of participant diversity in psychological research (Andoh, 2021). Meaningful psychological research requires a representative sample of the population. Unfortunately, most standardization samples in psychological research are made up of individuals from Western, educated, industrialized, rich, and democratic (WEIRD) societies (Henrich et al., 2010). In reviewing databases from across the behavioral sciences, Heinrich and colleagues found that there was substantial variability in results, and WEIRD participants were unusual compared to other members of the species. Heinrich et al. reviewed research on visual perception, fairness, cooperation, spatial reasoning, categorization and inferential induction, moral reasoning, reasoning styles, self-concepts and related motivations, and the heritability of IQ. They found that members of WEIRD societies, who were predominantly from American universities and Europe, were less representative of the world populations as a whole. The results obtained from WEIRD participants often distort the generalizations made about mental processes and human behavior, and consequently more research on Black, Indigenous, and other people of color (BIPOC) is needed (Andoh, 2021).
In the next module we will examine the role of biology on gender, including genes, prenatal hormones, and the variations in sexual development. The module will also consider how biology affects sexual development across the lifespan.
